A guide to using Gyule
-
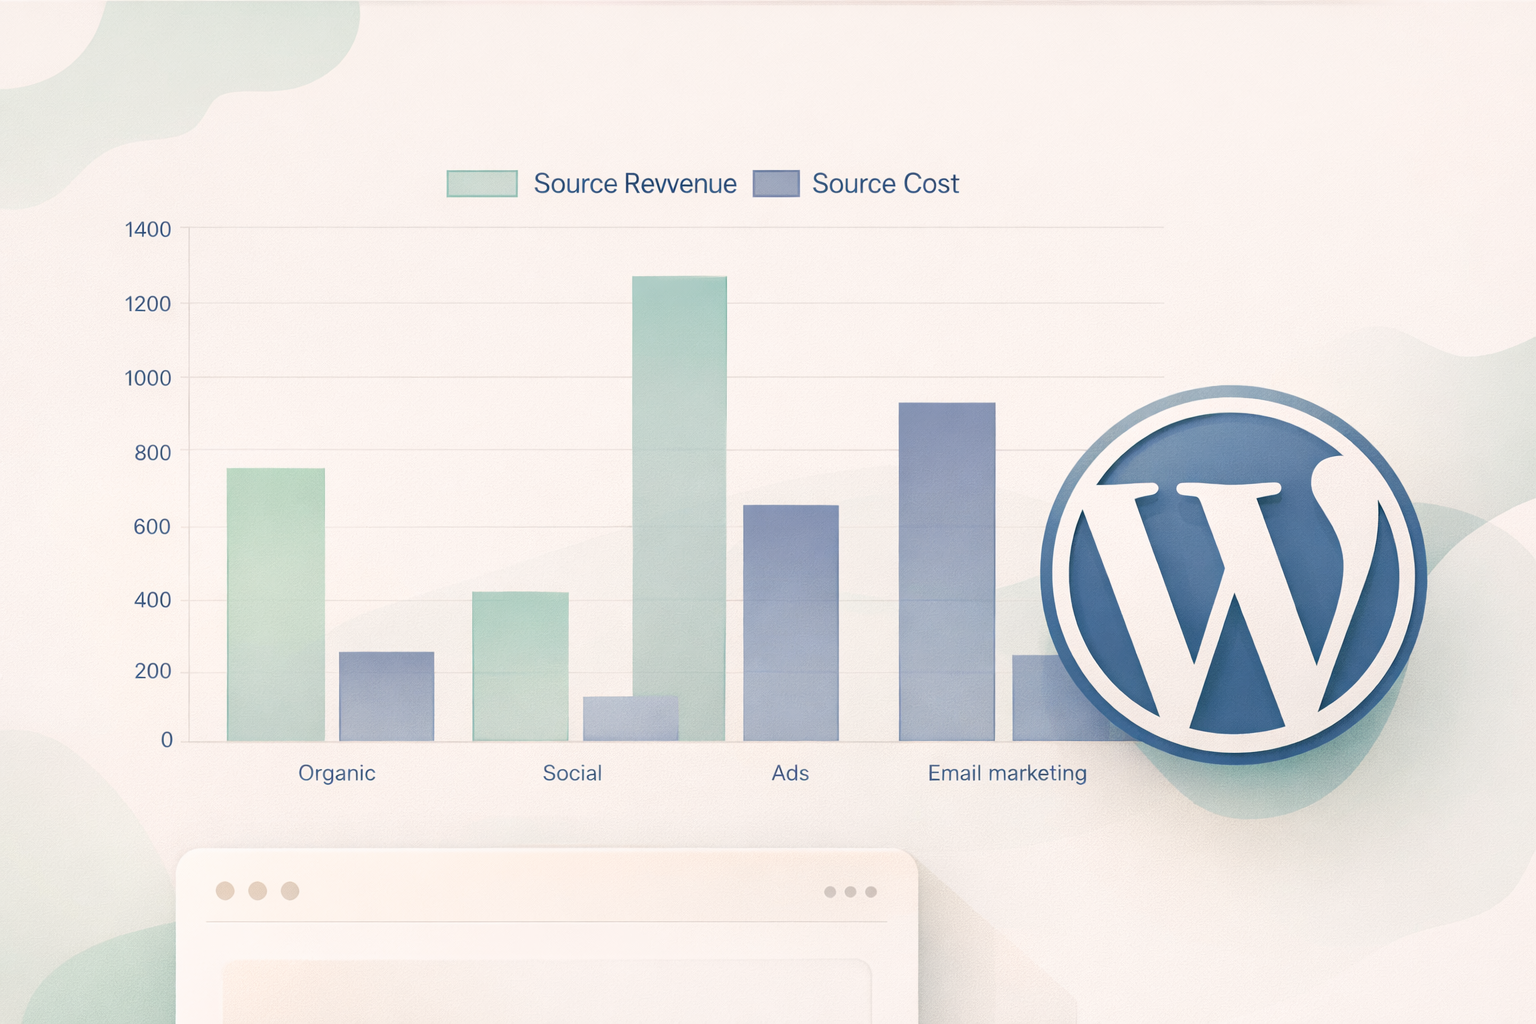
How to insert Charts and Graphs in WordPress
In this article, we will see how to insert a dashboard with charts in WordPress. The process is very simple. In this example, we show how to do it using Gutenberg, but we can do…
-

What Is Sentiment Analysis and How to Perform It Effectively
Sentiment Analysis is a Natural Language Processing (NLP) technique used to understand how people feel about topics, brands, events, or public figures by analyzing textual content. It allows organizations to measure whether opinions expressed in…
-

The best KPIs for E-commerce and how to visualize them
Running an e-commerce business without tracking the right KPIs is like navigating without a map. Key Performance Indicators (KPIs) help you understand how your store is performing, where you are losing opportunities, and how to…
-

How to publish a dashboard on your site
In this article, we show how to publish a dashboard and charts on your site. You can publish dashboards on any website, regardless of the technology used, thanks to the Gyule app. To create a…
-

Top SaaS KPIs Explained and How to Visualize Them for Better Decisions
In the competitive world of Software-as-a-Service, data is far more than a collection of number. It is the lens through which a SaaS business understands its financial health, customer behavior, marketing effectiveness, and long-term sustainability.…
-

How to Turn a Google Sheet Into a Dashboard Using Gyule.io
Transforming a simple Google Sheet into a useful, visually appealing dashboard is easier than you might think. With Gyule.io, you can connect your spreadsheet and instantly create charts that update automatically. In this guide, I’ll…